Objective:
Learn how to view and display imported CFD data in nTop. This is generally the first step to utilizing external fields in nTop to enhance and optimize designs based on specific field variables, such as pressure, velocity, stress, and heat flux.
Procedure:
There are two main avenues for accomplishing the above Objective. The first method is importing a CSV file, and the second is importing the results files directly. First, let's start with the CSV file. We generate and export a CSV file from your CFD results to do this. You can learn how we do this in Ansys's CFD Post.
Part 1: Working with a CSV File
Once the CSV file is generated we use the Import Scalar Point Map or Import Vector Point Map blocks to bring in the appropriate point map, both blocks can be seen in Image #1 below. More information about these blocks can be found here.
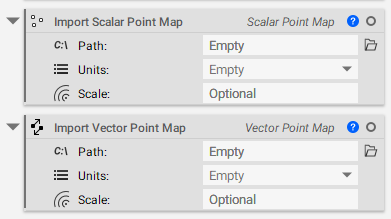
Image #1: Scalar and Vector Point Map blocks.
Once the inputs of File Path and Units are satisfied, as in Image #2 below, you can view the imported data, as in Images #3-#5.
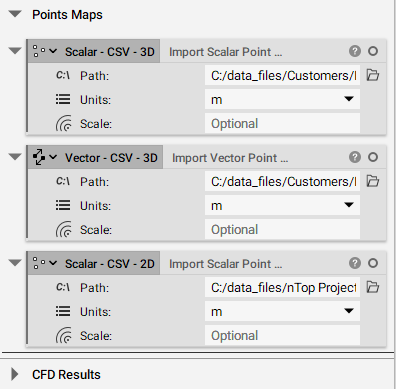
Image #2: Filled in point map blocks.
Image #3: 3D Scalar Point Map Image #4: 3D Vector Point Map, in a Cross-Sectional View
Image #5: 2D Scalar Point Map
Part 2: Working with Fluent Results File
The second way to view CFD results is by importing the CFD results files directly. This is done by using the Import CFD Analysis Results block, seen in Image #6 below.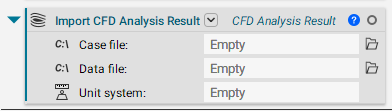
Image #6: Import CFD Analysis Result block
Once the Case and Data file paths and the Unit inputs are satisfied, you can view the imported data, see Image #7 below. The example images below are from a Conjugate Heat Transfer analysis of a cross-flow HEX with a simple TPMS Core.
Subsequent blocks are required to discretize the predefined variables that get imported from the CFD results file (i.e., Pressure, Temperature, Density). Images #8-11 below show the subsequent blocks and their outputs.
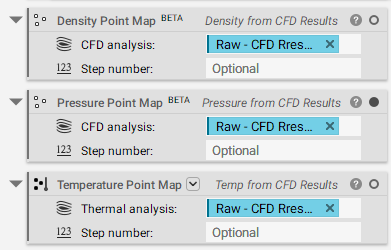
Image #8: Density, Pressure, and Temperature Point Map from analysis results.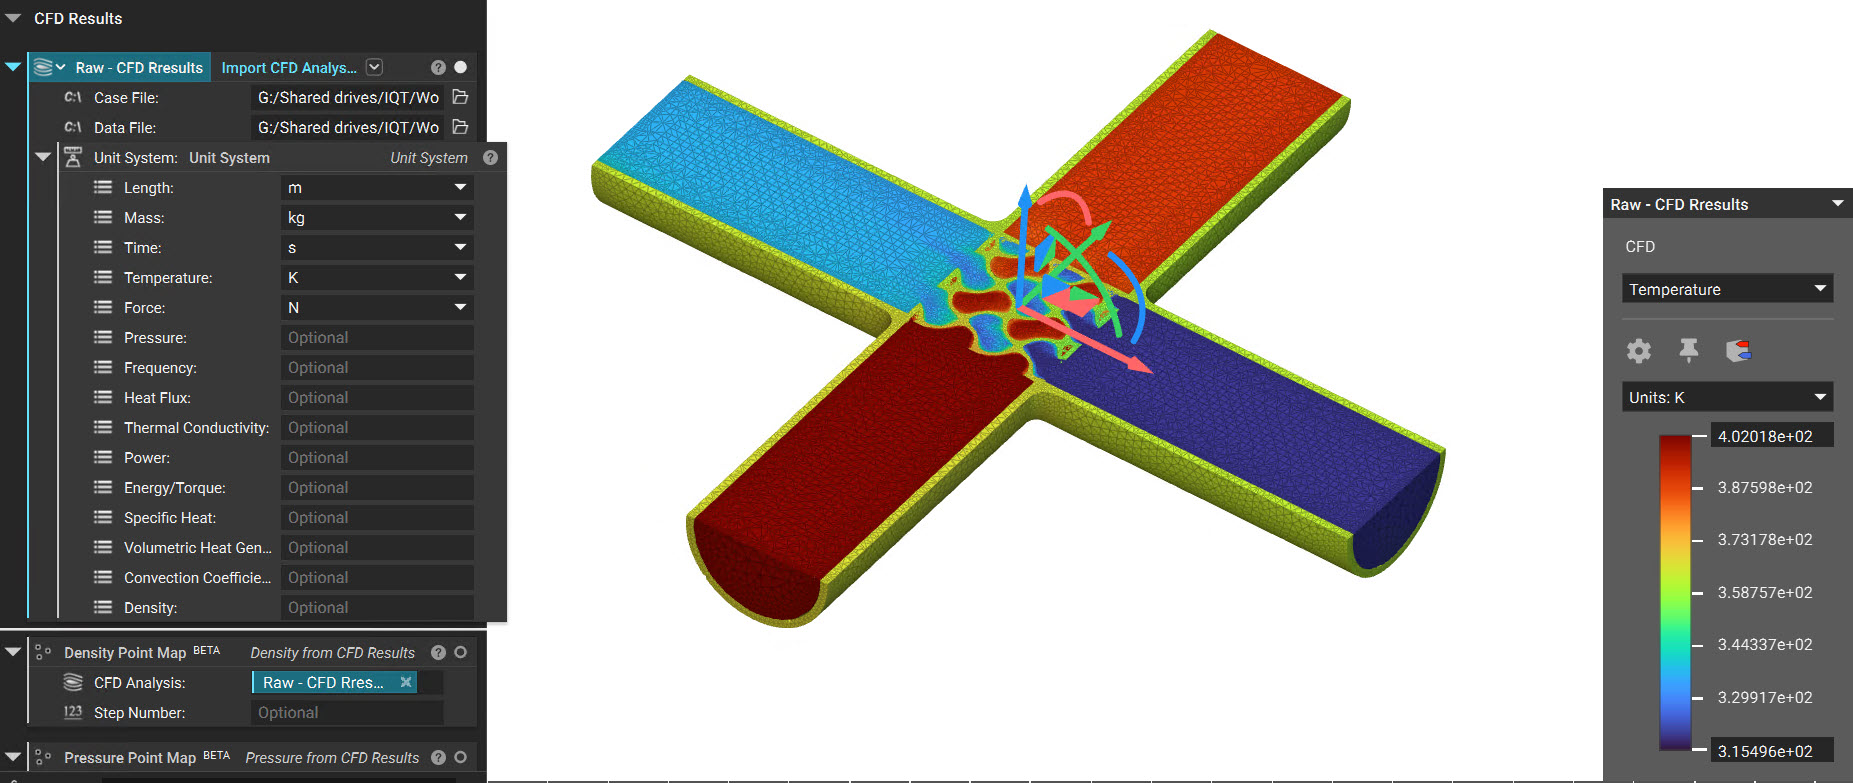 Image #9: Cross Section of Import CFD Results from a Conjugate Heat Transfer Analysis
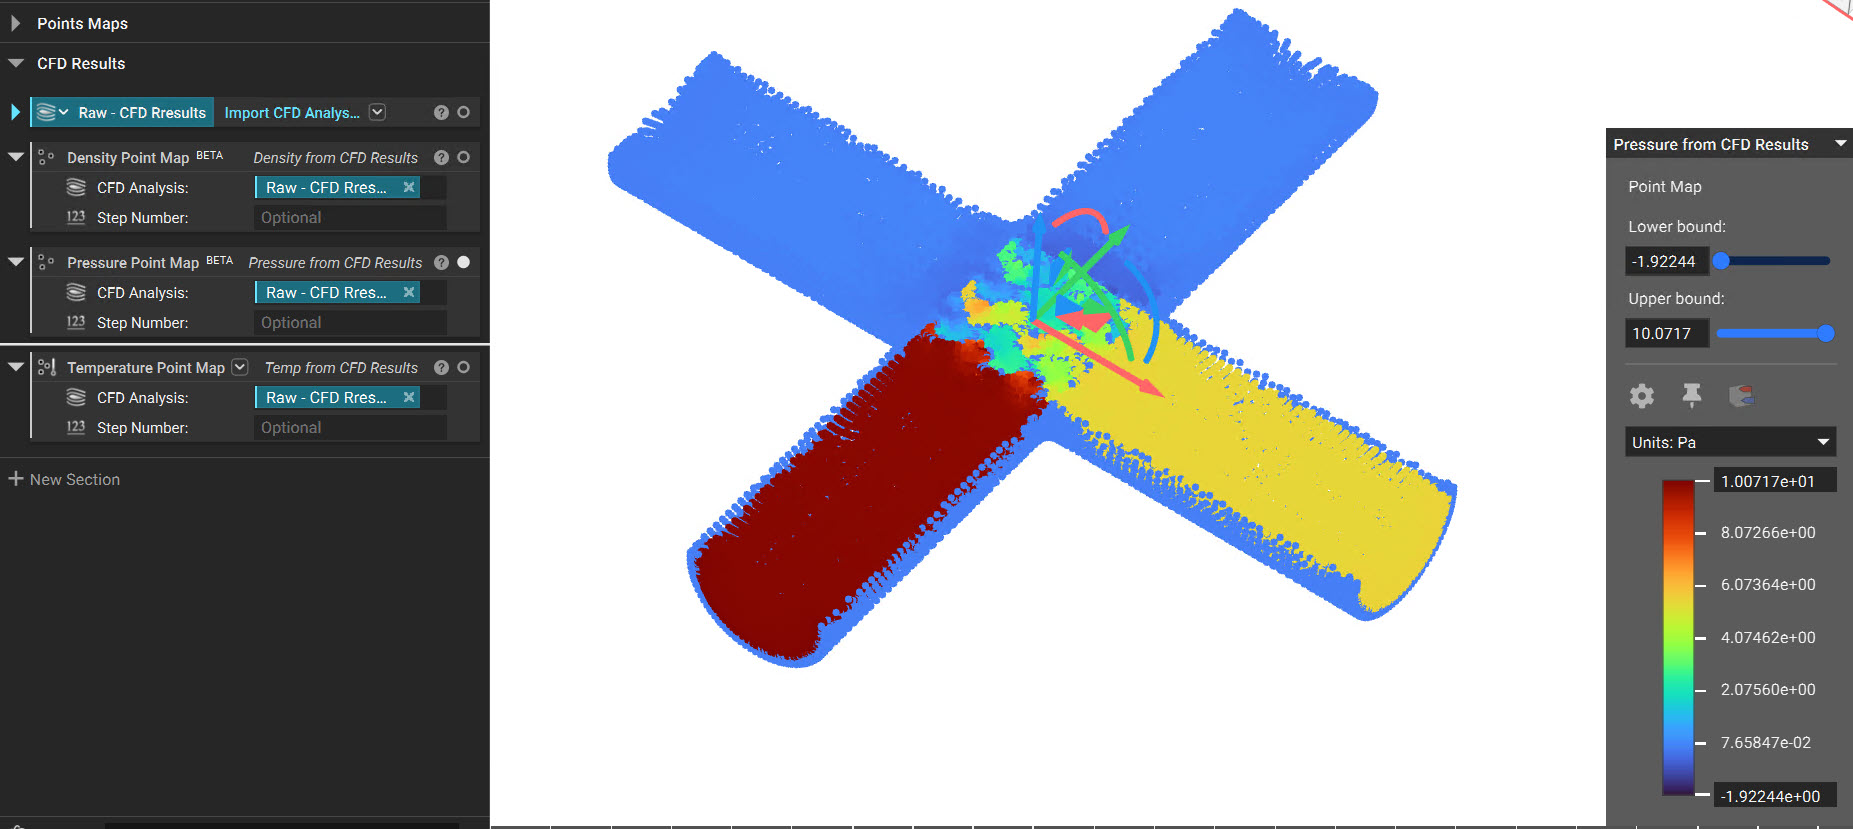 Image#10: Cross Section of the Point Map values related to Pressure
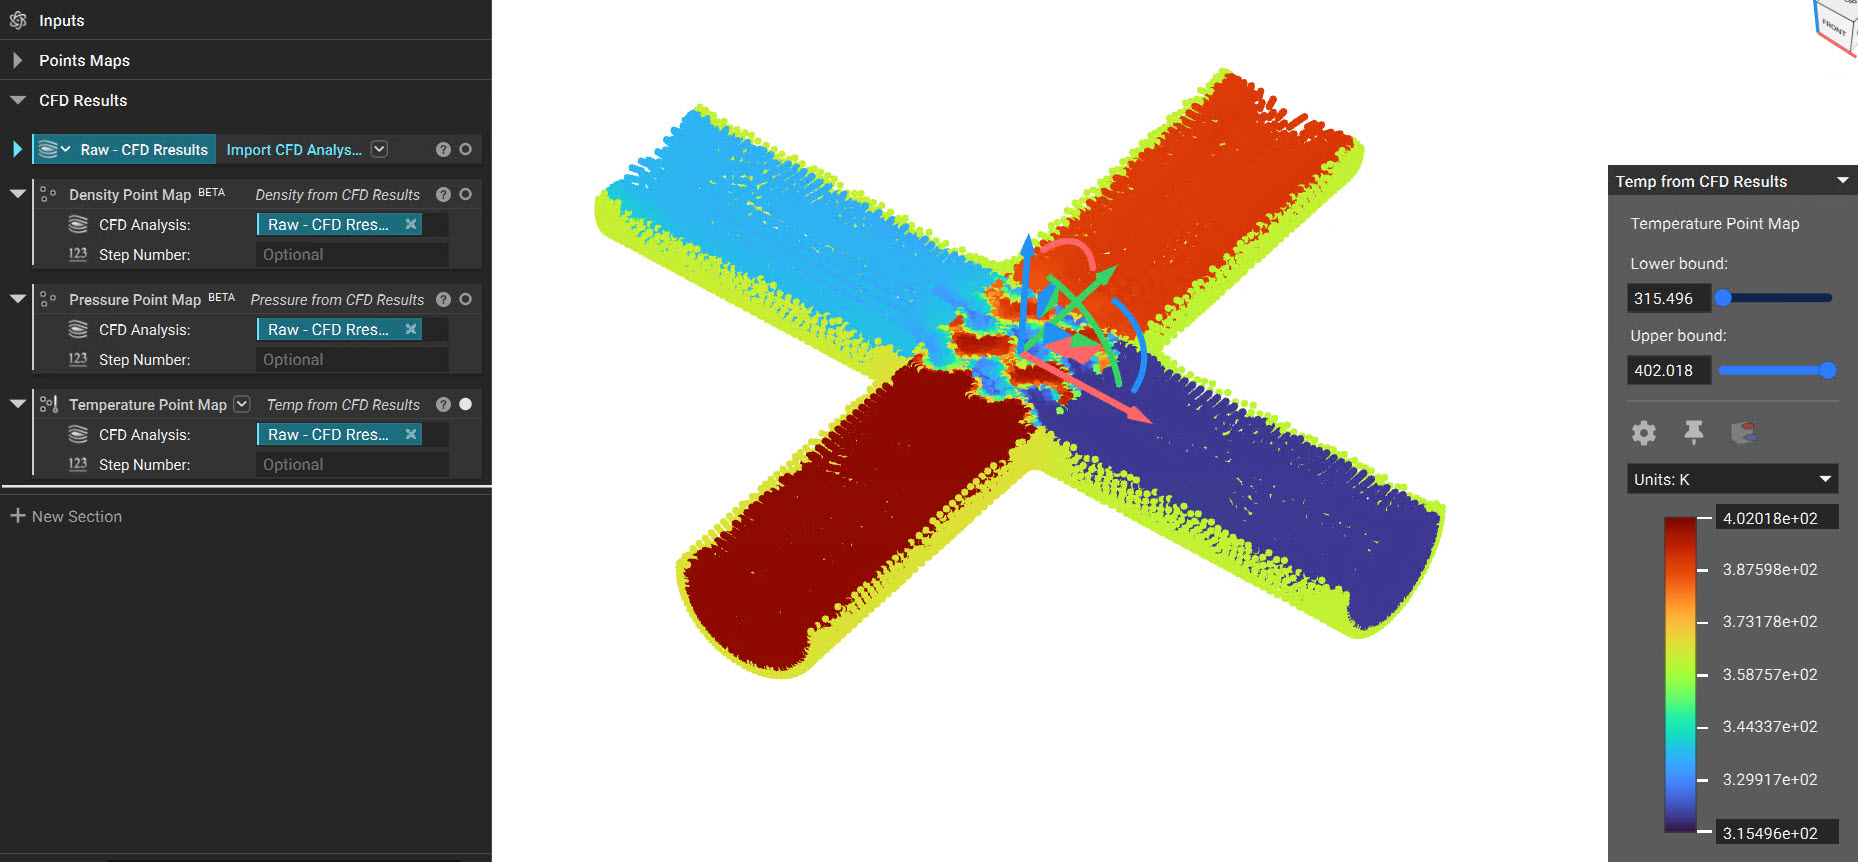
Image#11: Cross Section of the Point Map values related to Temperature
Note:
- While we are currently limited to Pressure, Temperature, Density variables via the Import CFD Analysis Result block, any variable we can export into a CSV format can be utilized in nTop to enhance designs.
- At the moment is it recommend that you export a CSV file and bring it in, as seen in Part 1 of this article.
That should do it! If you followed the steps above you should now know how to Import both CSV Files as well as your Case and Data files!
If you still have questions the support team would be happy to help you.